Research
Top Tasks for a New Product
Role: User Experience Strategist
Gaining a concrete understanding of what features really mattered to our user base.
Objective
Gain a clear understanding of our user's most important tasks they need to carry out in order to do their jobs well, so that we would build the right things in our new product.
Tools & Methodology
- Survey
- Graphing
- Summarized reporting & documentation
Overview
A top tasks survey seeks to understand who our users are and what they are trying to their job. By understanding the tasks they need to accomplish, we can understand how our product can best fit into their workflows and meet their needs. The key is not to focus on using our software, but focus on doing their job.
As we were beginning a new software product from scratch, I identified the need to perform this research in order to aide product in making initial feature decisions.
Demographics
Respondents were asked to identify their primary job role. The options given were, Call Taker, Dispatcher, Call Taker + Dispatcher, Supervisor, and Admin.
It was at that point possible to group the respondents into two groups: Dispatchers & Supervisors. The needs of all the roles could be more easily represented this way. The nature of these roles allowed me to do this. In other cases, I would not necessarily combine roles.
| Role | Percent of Respondents |
| Call Taker | 2% |
| Dispatcher | 7% |
| Call Taker/Dispatcher | 34% |
| Supervisor | 29% |
| Administrator | 28% |
Tasks
The goal was to determine tasks the user wanted to accomplish, irrespective of the software being used. From a list of over 150, the product owner and myself compiled the tasks down to 67. The tasks were randomized to give each task an equal chance of being seen.
Users were instructed to rate five tasks out of the 67. Their instructions were as follows:
Please look at the following list and choose ONLY the top FIVE most important things to you when you're doing your job. Give a score of five to the task MOST IMPORTANT to you, four to the next most important, then three, two, one. Please give only one score of 5, one 4, one 3, one 2, and one 1. Leave the rest blank. Trust your first instincts, and spend no more than five minutes on this exercise.
Results
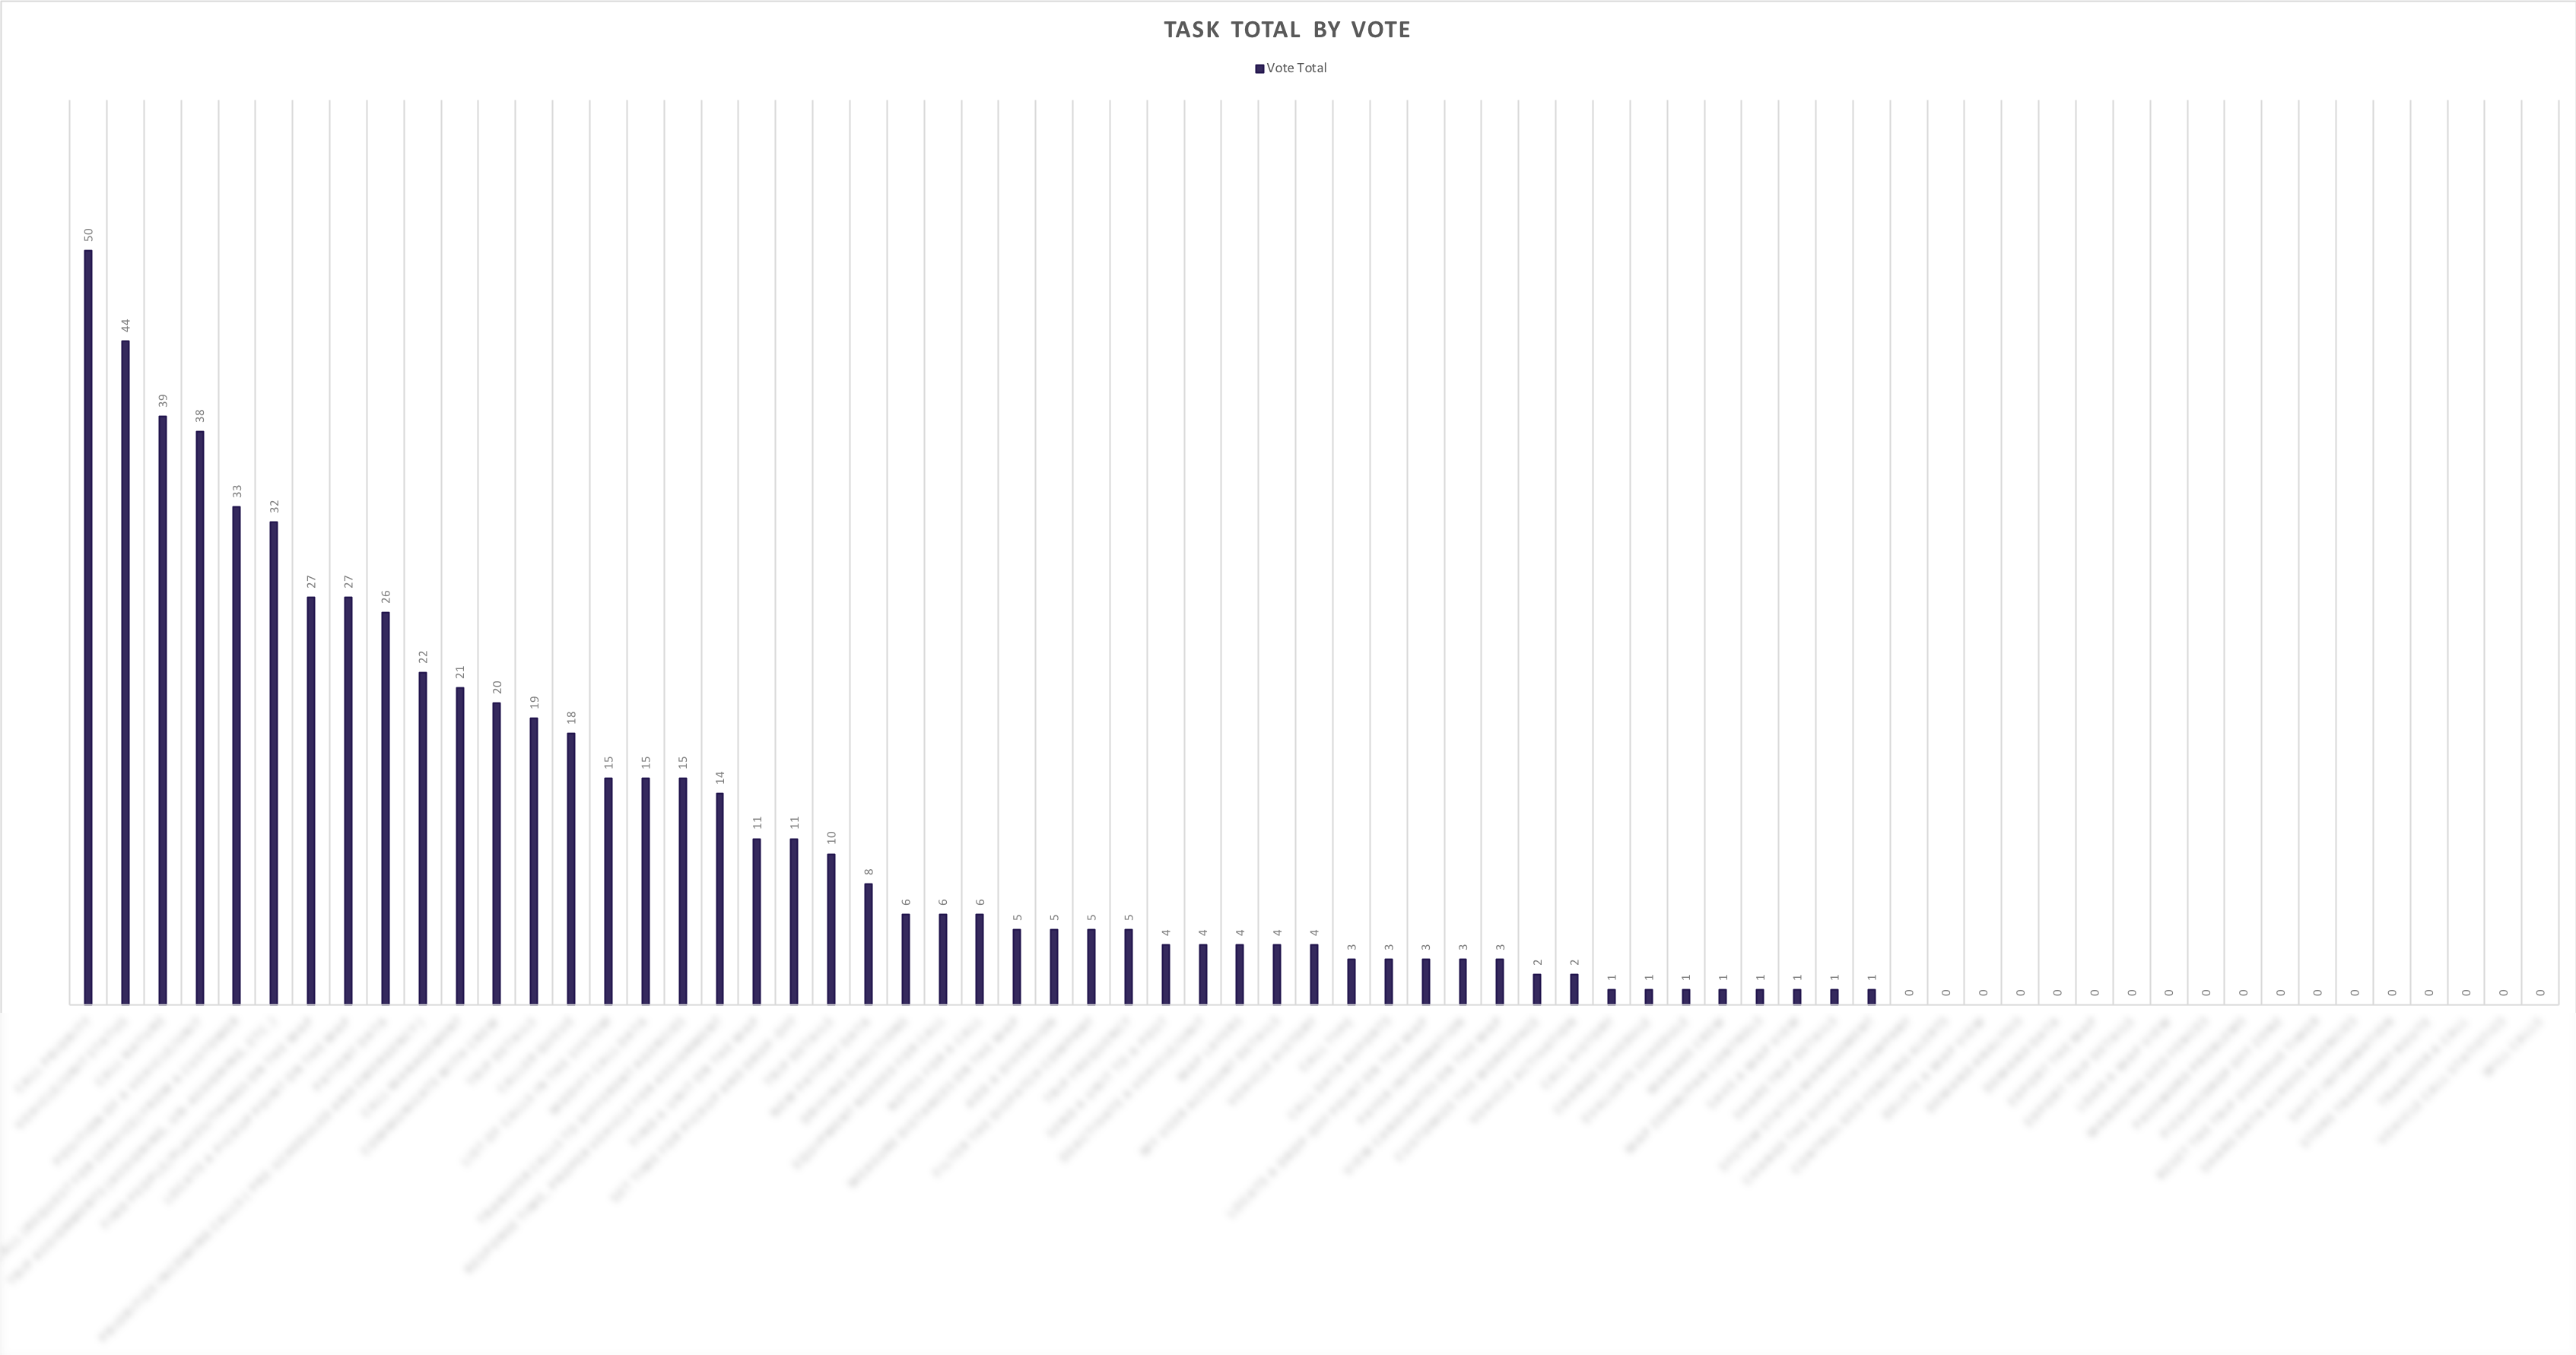
From the results we were able to gain a clear picture of what was most important to our users. The "long neck", or the top most important tasks would be the starting point for what we planned to build.
| Rank | Task |
| 1 | Call priority |
| 2 | Vehicle/unit status |
| 3 | Call nature |
| 4 | Position of a vehicle/unit |
| 5 | Take a call (request for service) from a customer |
Supervisors had a slightly different focus, as would be expected:
| Rank | Task |
| 1 | Call data reports |
| 2 | Call priority |
| 3 | Call management |
| 4 | Vehicle/unit status |
| 5 | Add a diversion |
While there were differences in the two roles, it was clear what it took to do their jobs. Out of the dispatcher's and supervisor's responses, only three tasks overlapped: call priority, vehicle/unit status, patient data.
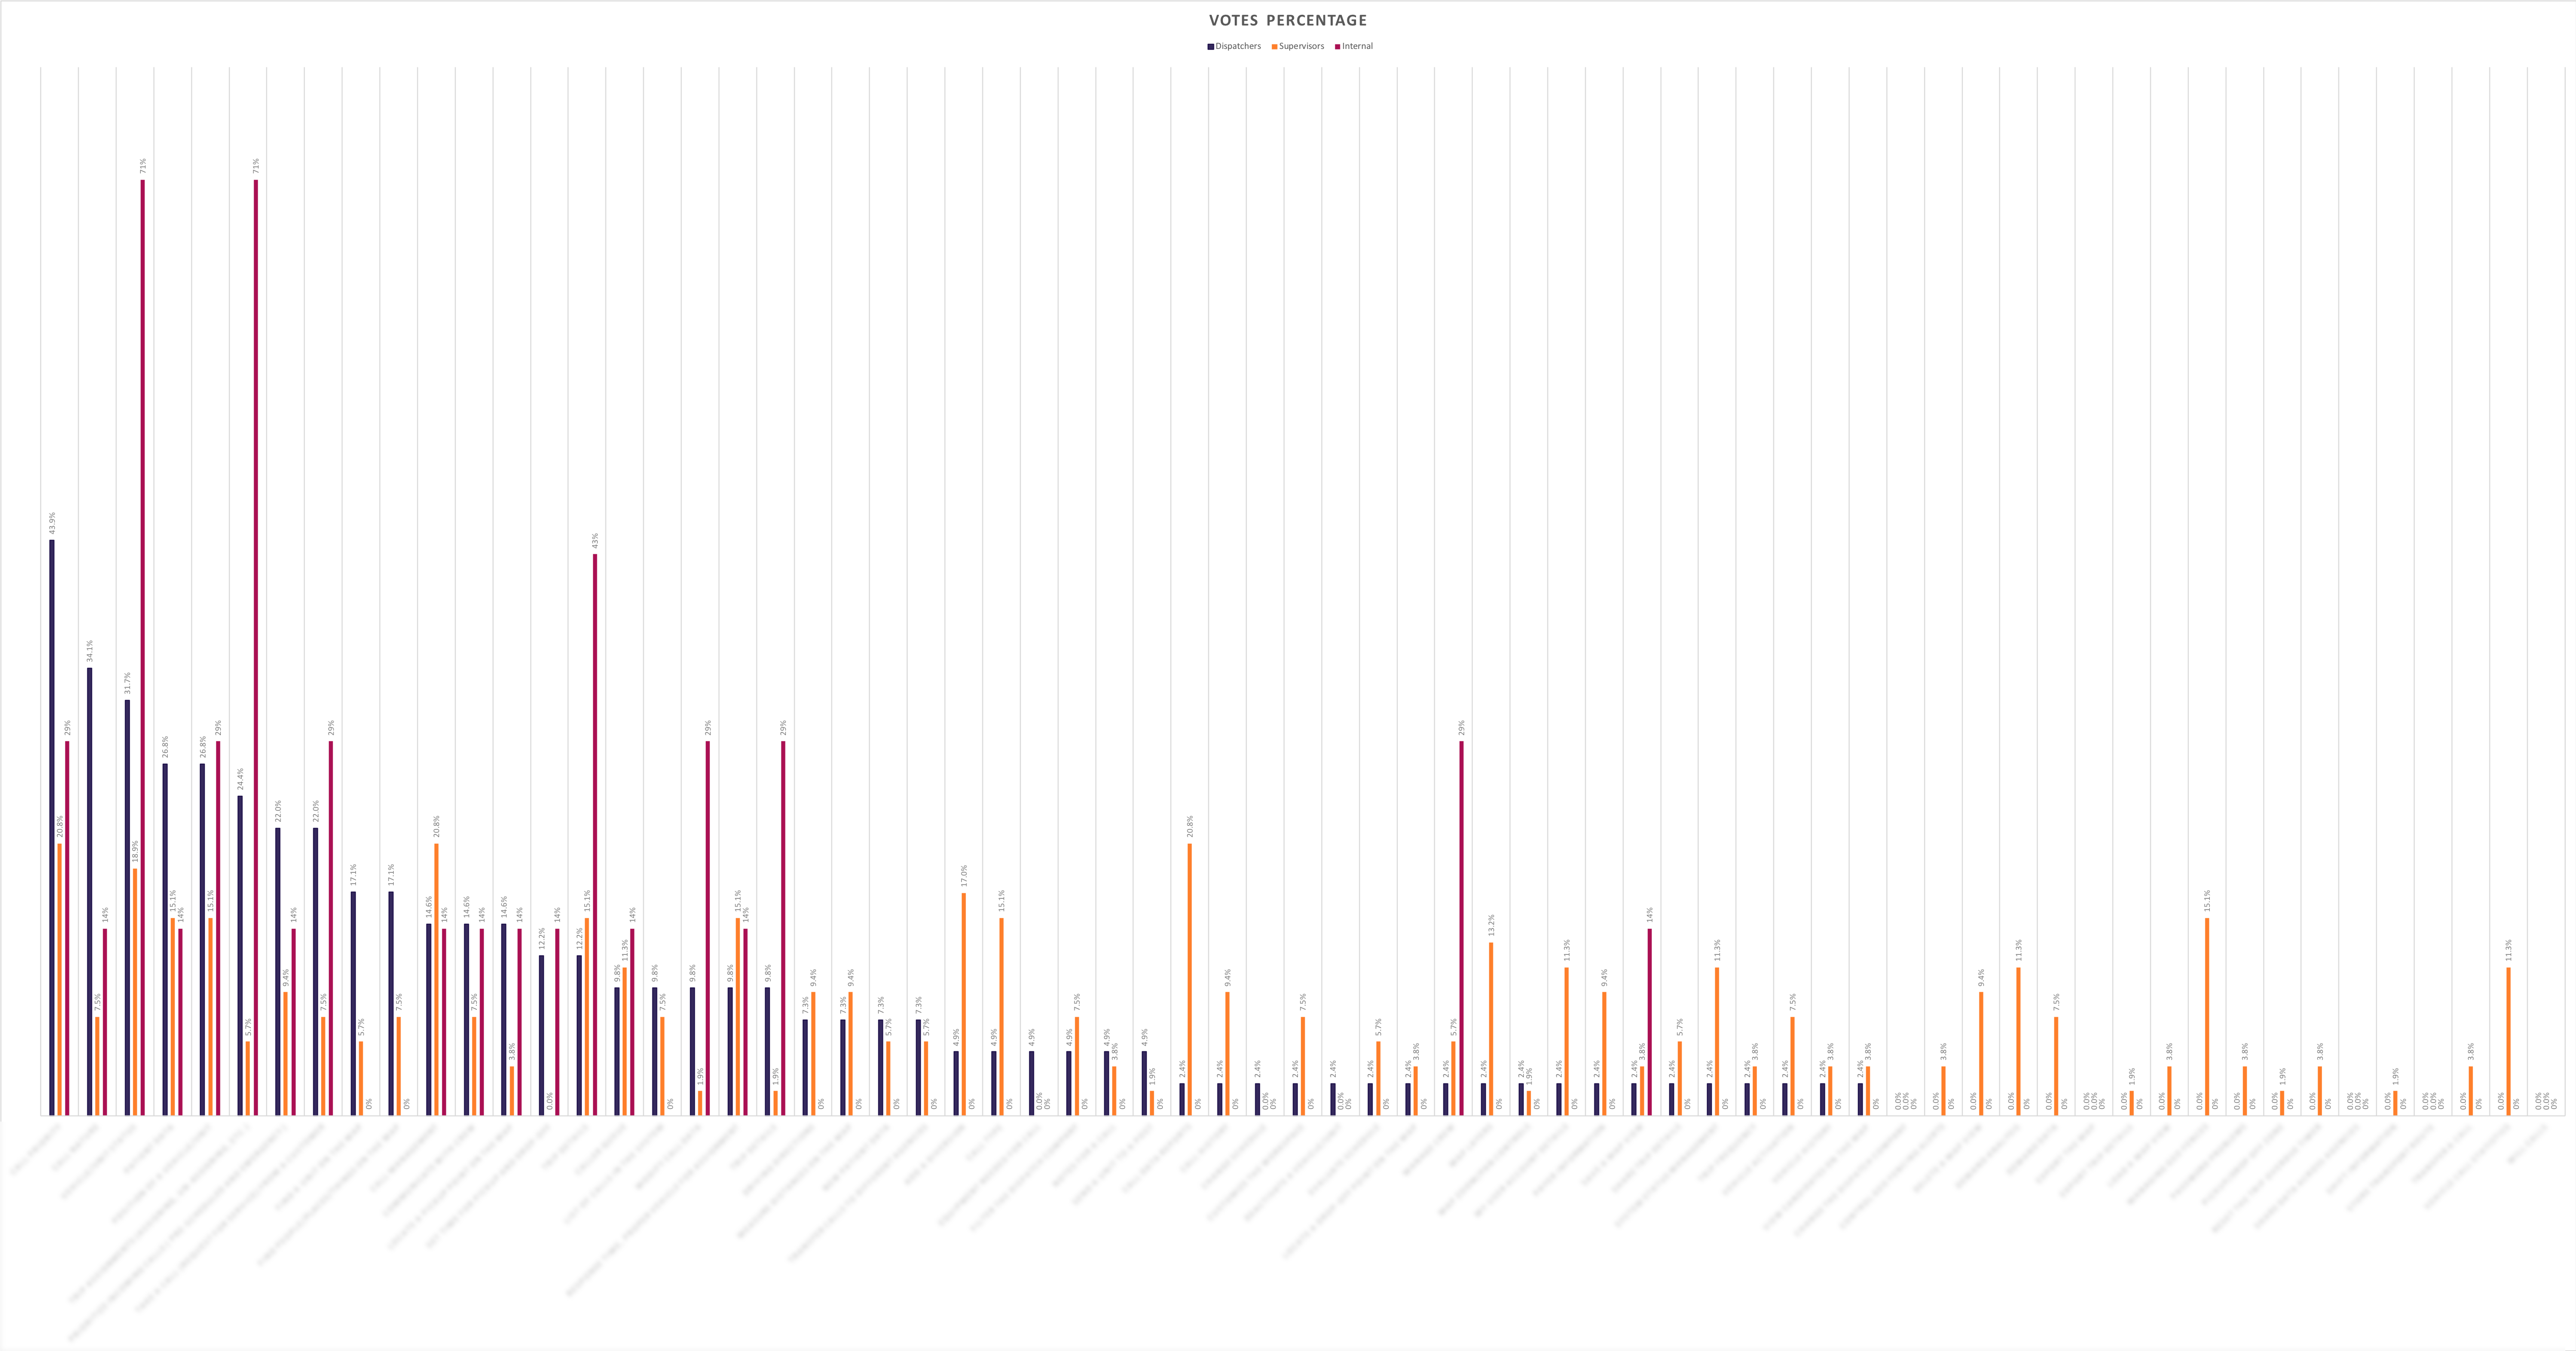
Beware Assumptions
Finally, I had my team and internal stakeholders toke the same task survey. I wanted to see if our assumptions matched our user's expectations. You can see in the graph that they did not align.
Outcomes
This research put the team on a sure footing as we combined this with other market and user research. It provided actual data that was hard to argue with, which, among other things, saved us time in disagreements over what to build.
I presented the findings to my team and the team leadership. This enabled the team to have confidence that the features we began to develop were the right features for our users.